Showing posts with label linux. Show all posts
Showing posts with label linux. Show all posts
Monday, May 18, 2015
Linux Memory Forensics: Using mprotect() with PROT_NONE
In case you didn't catch it on the Volatility Labs blog, I found an interesting bug that we've had in the framework since we've had Linux support. If you've had cases that involved Linux samples and plugins like linux_yarascan, linux_strings etc, you might want to update to the latest code and have another look over those samples. Of course, there's no reason to think that a piece of malware might have used this trick and used a sigsegv handler to access the data, but the idea has been around for years...

Saturday, September 29, 2012
Week 3 of the Month of Volatility Plugins posted!
Cross listed from Andrew Case's blog:
I was writing to announce that week 3 of the month of Volatility plugins is finished, and we now have five more in-depth blog posts covering Windows and Linux internals and rootkit detection as well as a bonus plugin that analyzes Internet Explorer browsing history. These have all been posted on the Volatility Labs blog.
Post 1: Detecting Malware Hooks in the Windows GUI Subsystem
This Windows focused post covers detecting malware hooks in the Windows GUI subsystem, including message hooks and event hooks, and what effects these hooks can have on a compromised system.
http://volatility-labs.blogspot.com/2012/09/movp-31-detecting-malware-hooks-in.html
Post 2: Shellbags in Memory, SetRegTime, and TrueCrypt Volumes
This Windows focused post covers finding and recovering shellbags from memory, the forensics importance of shellbags, and analyzes the effects of anti-forensics on shellbag timestamps. It concludes with covering the traces left in shellbags by TrueCrypt.
http://volatility-labs.blogspot.com/2012/09/movp-32-shellbags-in-memory-setregtime.html
Post 3: Analyzing USER Handles and the Win32k.sys Gahti
This Windows focused post introduces two new plugins, one named gahti that determines the various different types of USER objects on a system and another named userhandles which traverses the handle table entries and associates them with the owning processes or threads
http://volatility-labs.blogspot.com/2012/09/movp-33-analyzing-user-handles-and.html
Post 4: Recovering tagCLIPDATA: What's In Your Clipboard?
This Windows focused post covers recovery of the Windows clipboard from physical memory.
http://volatility-labs.blogspot.com/2012/09/movp-34-recovering-tagclipdata-whats-in.html
Post 5: Analyzing the 2008 DFRWS Challenge with Volatility
This Linux focused post analyzes the 2008 memory challenge with Volatility. It walks through the artifacts produced by the winning team and shows how to recover the same information with Volatility. It then shows plugins in Volatility that can recover artifacts not produced by the winning team.
http://volatility-labs.blogspot.com/2012/09/movp-35-analyzing-2008-dfrws-challenge.html
Bonus Post: HowTo: Scan for Internet Cache/History and URLs
This Windows focused post covers how to recover Internet Explorer's cache and history from a memory sample.
http://volatility-labs.blogspot.com/2012/09/howto-scan-for-internet-cachehistory.html
If you have any questions or comments on the posts, please leave a comment on the respective post on the Volatility Labs blog.
Friday, September 21, 2012
Week 2 of the Month of Volatility Plugins posted!
It's been an exciting week in the Volatility community. We've just finished our second week of Month of Volatility Plugins (MoVP) blogposts, released Volatility 2.2 RC2 for testing, fixed a few minor bugs and now we're gearing up for our third week of posts and the upcoming Open Memory Forensics Workshop (OMFW). Here is a list of this week's posts, compiled by Andrew Case:
We hope you've enjoyed this week's series. Stay tuned, we have much more in store!
I was writing to announce that week 2 of the month of Volatility plugins is finished, and we now have five more in-depth blog posts covering Windows and Linux internals and rootkit detection. These have all been posted to the new Volatility Labs blog.
Post 1: Atoms (The New Mutex), Classes and DLL Injection
This Windows focused post covers investigating malware and understanding infections by analyzing the atom tables.
http://volatility-labs.blogspot.com/2012/09/movp-21-atoms-new-mutex-classes-and-dll.html
Post 2: Malware in your Windows
This Windows focused post covers enumerating and analyzing windows in the GUI subsystem.
http://volatility-labs.blogspot.com/2012/09/movp-22-malware-in-your-windows.html
Post 3: Event logs and Service SIDs
This Windows focused post demonstrates recovering event logs from memory and calculating service SIDs.
http://volatility-labs.blogspot.com/2012/09/movp-23-event-logs-and-service-sids.html
Post 4: Analyzing the Jynx rootkit and LD_PRELOAD
This Linux focused post covers analyzing the Jynx rootkit as well as generic methods for analyzing LD_PRELOAD based rootkits.
http://volatility-labs.blogspot.com/2012/09/movp-24-analyzing-jynx-rootkit-and.html
Post 5: Investigating In-Memory Network Data with Volatility
This Linux focused post goes through each of the Linux Volatility plugins related to recovering network data from memory, such as network connections, packets, and the routing cache.
http://volatility-labs.blogspot.com/2012/09/movp-25-investigating-in-memory-network.html
If you have any questions or comments on the posts, please leave a comment on the respective post on the Volatility Labs blog.
We hope you've enjoyed this week's series. Stay tuned, we have much more in store!
Tuesday, March 22, 2011
Volatility 1.4 get_plugins Script
For those who can't wait for the official release of 1.4: I've updated the Volatility Full Dev Installation Wiki to include installation on Linux.
In case you want to automate installation you can use the new get_plugins script. I've only tested it on Mac OSX and Ubuntu, but it should still install dependencies and Volatility 1.4 on other Linux distributions (provided that you have your supporting libraries like libpcre installed already). Feel free to look at the code before running however :-)
Caveat: There is still an issue with the Distorm3 library on Mac OSX and you'll have to compile and install that one manually.
In case you want to automate installation you can use the new get_plugins script. I've only tested it on Mac OSX and Ubuntu, but it should still install dependencies and Volatility 1.4 on other Linux distributions (provided that you have your supporting libraries like libpcre installed already). Feel free to look at the code before running however :-)
Caveat: There is still an issue with the Distorm3 library on Mac OSX and you'll have to compile and install that one manually.
Saturday, January 02, 2010
Briefly: Misc News
Into the Boxes Issue 0x0 is now out. It contains a small article on Linux memory forensics I wrote as well as a cool article on Windows 7 UserAssist Registry Keys by Didier Stevens, a hardware quick tip and FTK imager quick tip by Don C. Weber and a PCI interview with Harlan Carvey. For those who are interested in contributing to future publications, check out the Collaboration Box. Congratulations to Don and Harlan on the first release!
There is a new meetup group that I am helping to organize: NYC4Sec. The group consists of computer security, forensics and compliance professionals based in the Tri-State area and we will be meeting to discuss the latest trends in threats and responses as well as what to do when attacked. We are aiming to meet at the end of the month. Feel free to sign up and come to the meeting. If anyone is interested in presenting at the meeting, please contact myself or Morton Swimmer.
I have also been asked to give a talk at CEIC 2010. So if you are planning to attend, I'll see you there :-)
There is a new meetup group that I am helping to organize: NYC4Sec. The group consists of computer security, forensics and compliance professionals based in the Tri-State area and we will be meeting to discuss the latest trends in threats and responses as well as what to do when attacked. We are aiming to meet at the end of the month. Feel free to sign up and come to the meeting. If anyone is interested in presenting at the meeting, please contact myself or Morton Swimmer.
I have also been asked to give a talk at CEIC 2010. So if you are planning to attend, I'll see you there :-)
Sunday, December 20, 2009
Linux Memory Forensics: task_struct
A while back, I started blogging about /dev/kcore and had gotten up to the task_struct structure, promising to continue talking about it. Well, it's been a while since, but I have not forgotten. This will take more than one post to finish it up, however. Today we will start with a brief introduction. Later posts will continue our exploration concluding with some small real demonstrations.
task_struct
So what is the task_struct structure? It's a structure that contains information about what a process is doing. It allows the kernel to keep track of processes that are running, the states they are in as well as other information needed by that process during execution.
States of the process are also defined in include/linux/sched.h and let the kernel know if the process is running (TASK_RUNNING), interruptible (TASK_INTERRUPTIBLE), uninterruptible (TASK_UNINTERRUPTIBLE), stopped (TASK_STOPPED), being traced by a debugger (TASK_TRACED), or exiting (EXIT_ZOMBIE, EXIT_DEAD).
The task_struct structure also contains identifying information such as the process PID, thread group leader ID. There are also pointers to the parent process' task_struct structure and real_parent task_struct structure for debugging purposes.
Also contained in the task_struct structure is information about other relationships the current process has such as children or siblings.
The executable name excluding the path is also stored in task_struct as well as current directory information and file descriptors.
The signal_struct structure contains information regarding signals for this process as well as tty associated with it.
Also contained in the task_struct is the mm_struct which contains pointers to vm_area_structs which are areas of virtual memory. We will discuss mm_struct and vm_area_struct next time.
References:
Bovet, D., M. Cesati (2000). Understanding the linux kernel. Cambridge: O'Reilly Media.
Rusling, D. Virtual Memory, The Linux Tutorial http://www.linux-tutorial.info/modules.php?name=MContent&pageid=322
task_struct
So what is the task_struct structure? It's a structure that contains information about what a process is doing. It allows the kernel to keep track of processes that are running, the states they are in as well as other information needed by that process during execution.
States of the process are also defined in include/linux/sched.h and let the kernel know if the process is running (TASK_RUNNING), interruptible (TASK_INTERRUPTIBLE), uninterruptible (TASK_UNINTERRUPTIBLE), stopped (TASK_STOPPED), being traced by a debugger (TASK_TRACED), or exiting (EXIT_ZOMBIE, EXIT_DEAD).
The task_struct structure also contains identifying information such as the process PID, thread group leader ID. There are also pointers to the parent process' task_struct structure and real_parent task_struct structure for debugging purposes.
Also contained in the task_struct structure is information about other relationships the current process has such as children or siblings.
The executable name excluding the path is also stored in task_struct as well as current directory information and file descriptors.
The signal_struct structure contains information regarding signals for this process as well as tty associated with it.
Also contained in the task_struct is the mm_struct which contains pointers to vm_area_structs which are areas of virtual memory. We will discuss mm_struct and vm_area_struct next time.
References:
Bovet, D., M. Cesati (2000). Understanding the linux kernel. Cambridge: O'Reilly Media.
Rusling, D. Virtual Memory, The Linux Tutorial http://www.linux-tutorial.info/modules.php?name=MContent&pageid=322
Wednesday, October 21, 2009
Volatility Get Plugins Bash Script
Earlier I had written about all of the known Volatility plugins and how to go about installing them. Now I've decided to make things even easier for some, by including a bash script that will download and install all of these plugins. It will also install pefile, pycrypto and pydasm. I have tested it on a linux box as well as a cygwin installation.
Make sure you are running this as root (or with sudo) if you are doing this under Linux. Also make sure you have subversion installed.
Prereqs for Cygwin:
Obviously you must have Cygwin installed. In addition to what I have listed in a previous post, you will also need to install:
* wget
* unzip
* svn (subversion)
Hopefully I haven't forgotten anything... let me know if I have.
Simply unzip the bash script into the directory where you want Volatility installed. Then run the script:
This bash script removes one of the example files (memory_plugins/example3.py) since it has a conflicting _EPROCESS definition, so if you want that file - simply comment out that remove statement.
You will have to install Inline::Python yourself until I figure out a way to get it installed in a general fashion.
Let me know if you encounter errors.
Make sure you are running this as root (or with sudo) if you are doing this under Linux. Also make sure you have subversion installed.
Prereqs for Cygwin:
Obviously you must have Cygwin installed. In addition to what I have listed in a previous post, you will also need to install:
* wget
* unzip
* svn (subversion)
Hopefully I haven't forgotten anything... let me know if I have.
Simply unzip the bash script into the directory where you want Volatility installed. Then run the script:
$ ./get_plugins.bsh
This bash script removes one of the example files (memory_plugins/example3.py) since it has a conflicting _EPROCESS definition, so if you want that file - simply comment out that remove statement.
You will have to install Inline::Python yourself until I figure out a way to get it installed in a general fashion.
Let me know if you encounter errors.
Monday, August 24, 2009
/dev/crash Driver
As you may or may not know, some distributions (RHEL, Fedora, Ubuntu) block some reads and writes to /dev/mem and have for a while. I first came across this when writing my thesis at John Jay College. Since I was trying to test the memory encryption library I had written and original tests comprised of scanning all of memory, the /dev/mem barrier was a bit cumbersome. I had gotten around it by using a Python script called Zeppoo-dump.py (project no longer maintained) to overwrite the offending instructions.
The following code only allows access within the first 256 pages of memory. (/usr/src/linux/drivers/char/mem.c):
and from (/usr/src/linux/arch/x86/mm/init_32.c):
You can find a nice writeup by Anthony Lineberry from BH Europe 2009.
So suppose you want to collect the memory image from /dev/mem? What will happen if you try to do so on a machine that has CONFIG_STRICT_DEVMEM enabled? If you try to collect memory using dd you will see the following:
You should also see the following in /var/log/messages though some values will obviously vary:
So there has be a way around this, right? Checking the Redhat Crash Utility listserv yielded some good advice. There are three courses of action proposed:
(1) Rebuild your kernel without the CONFIG_STRICT_DEVMEM restriction.
(2) Port the Fedora /dev/crash driver (./drivers/char/crash.c) to your kernel.
(3) Write a kretprobe module that tinkers with the return value of the
kernel's devmem_is_allowed() function such that it always returns 1.
I don't want to recompile the kernel since I'll loose whatever is currently in memory, so I'll focus on (2). Since I am currently using Ubuntu instead of Fedora, I knew I would have to port the code over. So I found a copy of crash.c and crash.h and set to work. You can find the ported crash driver here as well as a Makefile.
Now, I take NO responsibility for what may happen to your machine if something goes wrong during installation. This is for a 32bit system, and I have only tested this on Ubuntu Ibex kernel 2.6.27-14-generic. I still need to do some testing and will probably have more to say about that later... That being said, we'll continue.
Grab the tar file from above and extract:
Go inside the newly created folder and compile the kernel module:
At this point you should have the following files:
The file of interest is the crash.ko kernel module. We will load this into the kernel and check that it is installed correctly:
So now we have a new device we can use to access memory: /dev/crash
I'm not yet sure what the "Bad address" error means, but I suspect it is because dd tried to read beyond the 3.3 GB of memory that I have available.
You can remove the crash.ko module like so when you are finished:
Now let's test the newly obtained memory dump to see if it works. I'm going to use the RH Crash Utility with the volatile patch which you can find here:
So far so good :-)
In order to compile the kernel so that you can use the RedHat Crash Utility, you can follow the Ubuntu tutorial. After installing the appropriate packages you may have to run the following command:
You should end up with a linux-source*.tar.bz2 file under /usr/src . You should also have at least one folder with the kernel headers for your current kernel. You can extract the .tar.bz2 file as so:
Go into the resulting folder and set following flag in the Makefile:
Copy the .config file from your /usr/src/linux-headers-$(uname -r) folder into the /usr/src/linux-source-$(uname -r) folder.
Now type make. After the kernel is finished compiling, you should end up with a vmlinux file. This is the uncompressed kernel image with the debugging information that you need in order to run the RH crash utility.
For more information on the RH Crash Utility, check out:
Official RH Crash Utility Website
Linux Memory Forensics by A. Walters, M. Cohen and D. Collett.
slides from CEIC
The following code only allows access within the first 256 pages of memory. (/usr/src/linux/drivers/char/mem.c):
#ifdef CONFIG_STRICT_DEVMEM
static inline int range_is_allowed(unsigned long pfn, unsigned long size)
{
u64 from = ((u64)pfn) << PAGE_SHIFT;
u64 to = from + size;
u64 cursor = from;
while (cursor < to) {
if (!devmem_is_allowed(pfn)) {
printk(KERN_INFO
"Program %s tried to access /dev/mem between %Lx->%Lx.\n",
current->comm, from, to);
return 0;
}
cursor += PAGE_SIZE;
pfn++;
}
return 1;
}
#else
static inline int range_is_allowed(unsigned long pfn, unsigned long size)
{
return 1;
}
and from (/usr/src/linux/arch/x86/mm/init_32.c):
int devmem_is_allowed(unsigned long pagenr)
{
if (pagenr <= 256)
return 1;
if (!page_is_ram(pagenr))
return 1;
return 0;
}
You can find a nice writeup by Anthony Lineberry from BH Europe 2009.
So suppose you want to collect the memory image from /dev/mem? What will happen if you try to do so on a machine that has CONFIG_STRICT_DEVMEM enabled? If you try to collect memory using dd you will see the following:
# dd if=/dev/mem of=mem.dd
dd: reading `/dev/mem': Operation not permitted
2056+0 records in
2056+0 records out
1052672 bytes (1.1 MB) copied, 0.159965 s, 6.6 MB/s
You should also see the following in /var/log/messages though some values will obviously vary:
Aug 23 14:37:15 [comp name] kernel: [17415.953941] Program dd tried to access /dev/mem between 101000->101200.
So there has be a way around this, right? Checking the Redhat Crash Utility listserv yielded some good advice. There are three courses of action proposed:
(1) Rebuild your kernel without the CONFIG_STRICT_DEVMEM restriction.
(2) Port the Fedora /dev/crash driver (./drivers/char/crash.c) to your kernel.
(3) Write a kretprobe module that tinkers with the return value of the
kernel's devmem_is_allowed() function such that it always returns 1.
I don't want to recompile the kernel since I'll loose whatever is currently in memory, so I'll focus on (2). Since I am currently using Ubuntu instead of Fedora, I knew I would have to port the code over. So I found a copy of crash.c and crash.h and set to work. You can find the ported crash driver here as well as a Makefile.
Now, I take NO responsibility for what may happen to your machine if something goes wrong during installation. This is for a 32bit system, and I have only tested this on Ubuntu Ibex kernel 2.6.27-14-generic. I still need to do some testing and will probably have more to say about that later... That being said, we'll continue.
Grab the tar file from above and extract:
#tar -xvzf crash_driver_ubuntu.tgz
crash_driver/
crash_driver/crash.h
crash_driver/Makefile
crash_driver/crash.c
Go inside the newly created folder and compile the kernel module:
# cd crash_driver/
# ls
crash.c crash.h Makefile
# make
make -C /lib/modules/2.6.27-14-generic/build M=/home/levy/crash/crash_driver modules
make[1]: Entering directory `/usr/src/linux-headers-2.6.27-14-generic'
CC [M] /home/levy/crash/crash_driver/crash.o
Building modules, stage 2.
MODPOST 1 modules
CC /home/levy/crash/crash_driver/crash.mod.o
LD [M] /home/levy/crash/crash_driver/crash.ko
make[1]: Leaving directory `/usr/src/linux-headers-2.6.27-14-generic'
At this point you should have the following files:
# ls
crash.c crash.h crash.ko crash.mod.c crash.mod.o crash.o Makefile Module.markers modules.order Module.symvers
The file of interest is the crash.ko kernel module. We will load this into the kernel and check that it is installed correctly:
# insmod crash.ko
# lsmod |grep crash
crash 10368 0
# ls -l /dev/crash
crw-rw---- 1 root root 10, 59 2009-08-23 15:04 /dev/crash
# tail -n 1 /var/log/messages
Aug 23 15:04:10 [comp name] kernel: [19030.855920] crash memory driver: version 1.0
So now we have a new device we can use to access memory: /dev/crash
# dd if=/dev/crash of=crash.dd
dd: reading `/dev/crash': Bad address
6812680+0 records in
6812680+0 records out
3488092160 bytes (3.5 GB) copied, 157.964 s, 22.1 MB/s
I'm not yet sure what the "Bad address" error means, but I suspect it is because dd tried to read beyond the 3.3 GB of memory that I have available.
You can remove the crash.ko module like so when you are finished:
# rmmod crash
Now let's test the newly obtained memory dump to see if it works. I'm going to use the RH Crash Utility with the volatile patch which you can find here:
# ./crash -f /boot/System.map-2.6.27-14-generic /usr/src/linux-source-2.6.27/vmlinux crash.dd --volatile
crash 4.0-8.9
Copyright (C) 2002, 2003, 2004, 2005, 2006, 2007, 2008, 2009 Red Hat, Inc.
Copyright (C) 2004, 2005, 2006 IBM Corporation
Copyright (C) 1999-2006 Hewlett-Packard Co
Copyright (C) 2005, 2006 Fujitsu Limited
Copyright (C) 2006, 2007 VA Linux Systems Japan K.K.
Copyright (C) 2005 NEC Corporation
Copyright (C) 1999, 2002, 2007 Silicon Graphics, Inc.
Copyright (C) 1999, 2000, 2001, 2002 Mission Critical Linux, Inc.
This program is free software, covered by the GNU General Public License,
and you are welcome to change it and/or distribute copies of it under
certain conditions. Enter "help copying" to see the conditions.
This program has absolutely no warranty. Enter "help warranty" for details.
GNU gdb 6.1
Copyright 2004 Free Software Foundation, Inc.
GDB is free software, covered by the GNU General Public License, and you are
welcome to change it and/or distribute copies of it under certain conditions.
Type "show copying" to see the conditions.
There is absolutely no warranty for GDB. Type "show warranty" for details.
This GDB was configured as "i686-pc-linux-gnu"...
SYSTEM MAP: /boot/System.map-2.6.27-14-generic
DEBUG KERNEL: /usr/src/linux-source-2.6.27/vmlinux (2.6.27.18)
DUMPFILE: crash.dd
CPUS: 2
DATE: Mon Aug 23 12:31:54 2009
UPTIME: 02:44:55
LOAD AVERAGE: 0.10, 0.17, 0.17
TASKS: 252
NODENAME: --
RELEASE: 2.6.27-14-generic
VERSION: #1 SMP Tue Aug 18 16:25:45 UTC 2009
MACHINE: i686 (1994 Mhz)
MEMORY: 3.2 GB
PID: 0
COMMAND: "swapper"
TASK: c0471340 (1 of 2) [THREAD_INFO: c04aa000]
CPU: 0
STATE: TASK_RUNNING
crash>
So far so good :-)
crash> ps
PID PPID CPU TASK ST %MEM VSZ RSS COMM
0 0 0 c0471340 RU 0.0 0 0 [swapper]
> 0 0 1 f744e480 RU 0.0 0 0 [swapper]
1 0 0 f7448000 IN 0.1 3056 1900 init
2 0 1 f7448c90 IN 0.0 0 0 [kthreadd]
3 2 0 f7449920 IN 0.0 0 0 [migration/0]
4 2 0 f744a5b0 IN 0.0 0 0 [ksoftirqd/0]
5 2 0 f744b240 IN 0.0 0 0 [watchdog/0]
6 2 1 f744bed0 IN 0.0 0 0 [migration/1]
7 2 1 f744cb60 IN 0.0 0 0 [ksoftirqd/1]
8 2 1 f744d7f0 IN 0.0 0 0 [watchdog/1]
9 2 0 f744f110 IN 0.0 0 0 [events/0]
10 2 1 f7460000 IN 0.0 0 0 [events/1]
11 2 0 f7460c90 IN 0.0 0 0 [khelper]
[snip]
crash> foreach files
PID: 0 TASK: c0471340 CPU: 0 COMMAND: "swapper"
ROOT: / CWD: /
No open files
PID: 0 TASK: f744e480 CPU: 1 COMMAND: "swapper"
ROOT: / CWD: /
No open files
PID: 1 TASK: f7448000 CPU: 0 COMMAND: "init"
ROOT: / CWD: /
FD FILE DENTRY INODE TYPE PATH
0 f69c8300 f700c550 f695a3e0 CHR /dev/console
1 f69c8300 f700c550 f695a3e0 CHR /dev/console
2 f69c8300 f700c550 f695a3e0 CHR /dev/console
3 f69c8f00 f720d770 f7243c38 FIFO
4 f69c8780 f720d770 f7243c38 FIFO
5 f69c86c0 f7218990 f7045228 SOCK
6 f69c8b40 f70216e8 f70b6000 DIR inotify
PID: 2 TASK: f7448c90 CPU: 1 COMMAND: "kthreadd"
ROOT: / CWD: /
No open files
PID: 3 TASK: f7449920 CPU: 0 COMMAND: "migration/0"
[snip]
crash> foreach net
foreach: WARNING: net command requires -s or -S option
PID: 0 TASK: c0471340 CPU: 0 COMMAND: "swapper"
No open sockets.
PID: 0 TASK: f744e480 CPU: 1 COMMAND: "swapper"
No open sockets.
PID: 1 TASK: f7448000 CPU: 0 COMMAND: "init"
FD SOCKET SOCK FAMILY:TYPE SOURCE-PORT DESTINATION-PORT
5 f7045200 f6bfe380 UNIX:DGRAM
[snip]
In order to compile the kernel so that you can use the RedHat Crash Utility, you can follow the Ubuntu tutorial. After installing the appropriate packages you may have to run the following command:
sudo apt-get build-dep linux
You should end up with a linux-source*.tar.bz2 file under /usr/src . You should also have at least one folder with the kernel headers for your current kernel. You can extract the .tar.bz2 file as so:
# tar -xjf linux-source*.tar.bz2
Go into the resulting folder and set following flag in the Makefile:
CFLAGS_KERNEL = -g
Copy the .config file from your /usr/src/linux-headers-$(uname -r) folder into the /usr/src/linux-source-$(uname -r) folder.
Now type make. After the kernel is finished compiling, you should end up with a vmlinux file. This is the uncompressed kernel image with the debugging information that you need in order to run the RH crash utility.
For more information on the RH Crash Utility, check out:
Official RH Crash Utility Website
Linux Memory Forensics by A. Walters, M. Cohen and D. Collett.
slides from CEIC
Wednesday, February 25, 2009
Briefly: IDA Pro on CentOS 5.2
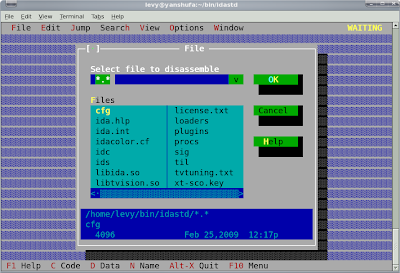
This is almost a non-post, but who knows, it might be useful to someone... So today I while installing Ida Pro on CentOS, I hit a small snafu. Everything went well for key extraction: here's a nice tutorial for that. However after I retrieved the key, I placed it according to the README file in the $HOME/.idapro directory.
However, when running it I was faced with the following problem:
I noticed that my library was incompatible since it was libstdc++.so.6. Luckily, there are ``compat'' packages that contain these older libraries. You can install them with yum:
At this point, IDA Pro starts up nicely:


However, when running it I was faced with the following problem:
$ ./idal
./idal: error while loading shared libraries: libstdc++.so.5: cannot open shared object file: No such file or directory
I noticed that my library was incompatible since it was libstdc++.so.6. Luckily, there are ``compat'' packages that contain these older libraries. You can install them with yum:
# yum install -y compat-libstdc++-33.i386
At this point, IDA Pro starts up nicely:


Wednesday, January 28, 2009
Hash of a CD
Recently I had to see if two CDs were identical. I had the hash value of the iso for the desired content so I decided to check the hash for both CDs. There is really not that much to this post, but just in case someone ever needs to know how to do this I'll give you the command line how-to.
In my case, md5sum /dev/cdrom did not work. Now there is no reason to copy the CD to an iso file in order to do this. You can just use dd and pipe the output into md5sum or sha1sum.
I found that just doing a straight dd without extra options did not work. So you should use isoinfo to get the logical block size and the volume size to feed to dd (bs="Logical block size" and count="Volume size"). I decided to put this all into a bash script you can find here. The code is shown below:
It's not the most beautiful solution, but there it is. This uses md5, for other hashes just modify the script as needed. Also if your CD device is not /dev/cdrom modify that as well.
In my case, md5sum /dev/cdrom did not work. Now there is no reason to copy the CD to an iso file in order to do this. You can just use dd and pipe the output into md5sum or sha1sum.
I found that just doing a straight dd without extra options did not work. So you should use isoinfo to get the logical block size and the volume size to feed to dd (bs="Logical block size" and count="Volume size"). I decided to put this all into a bash script you can find here. The code is shown below:
INFO=`isoinfo -d -i /dev/cdrom \
|awk '{ if ($1 ~ /Volume/ && $2 ~ /size/ ) print $4; \
else if ($1 ~ /Logical/ && $2 ~ /block/ && $3 ~ /size/) \
print $5 endif }'`
INFO=($INFO)
echo "Logical block size: ${INFO[0]}"
echo "Volume size: ${INFO[1]}"
echo "Now executing: "
echo "dd if=/dev/cdrom bs=${INFO[0]} count=${INFO[1]} conv=notrunc,noerror,sync | md5sum"
dd if=/dev/cdrom bs=${INFO[0]} count=${INFO[1]} \
conv=notrunc,noerror,sync | md5sum
It's not the most beautiful solution, but there it is. This uses md5, for other hashes just modify the script as needed. Also if your CD device is not /dev/cdrom modify that as well.
Tuesday, December 09, 2008
VMWare Workstation machine to VMWare Server
Recently I received a VMWare image to work on. I had installed VMware Server 1.0.8 on my CentOS 5.2 laptop because 2.0 is just painful. Unfortunately the image had been created with a newer version of Workstation rendering it incompatible with my install. I found the VMware converter, but it wasn't much help since I'm on a Linux machine.
I created a new default machine using VMware Server with the basic settings matching that of the target machine, copied the resulting .vmx file into the folder of the target machine. (I could have just modified the original .vmx file, but just decided to start over cleanly.)
So now the vmware machine tries to boot, but fails with the following message:
One or more of your disk files were created by a more recent version of VMware software and are not supported by this version of VMware Server.
Then I modified the vmdk descriptor file from:
to
Worked like a charm :-)
I don't know if this will work in every case, but it might be helpful to someone.
I created a new default machine using VMware Server with the basic settings matching that of the target machine, copied the resulting .vmx file into the folder of the target machine. (I could have just modified the original .vmx file, but just decided to start over cleanly.)
So now the vmware machine tries to boot, but fails with the following message:
One or more of your disk files were created by a more recent version of VMware software and are not supported by this version of VMware Server.
Then I modified the vmdk descriptor file from:
ddb.virtualHWVersion = "7"
to
ddb.virtualHWVersion = "4"
Worked like a charm :-)
I don't know if this will work in every case, but it might be helpful to someone.
Monday, September 22, 2008
/proc/kcore part II
It will take me a few posts to go through the kcore file... The last kcore post dealt only with ELF headers of the kcore file. After the ELF header ends, there are 3 program headers:
From elf.h we see that the structure of a program header is:
A look at the first program header below:
The first program header is of type PT_NOTE (Auxiliary info) which has a value of 0x4
We can see that the offset is 0x94
The filesize has a value of 0x7d8
All other parts of the struct are set to 0x0
A look at the second program header below:
The type is of type PT_LOAD 0x1 (loadable program segment)
The offset is 0x38801000
vaddr is 0xf8800000 (vmalloc)
filesz and memsz are both 0x6ffe000
flags are 0x7 (PF_R | PF_W | PF_X)
page alignment is 0x1000 (size of a page - 4096)
The other remaining part of the structure (p_paddr) is 0x0
The third program header looks like:
The type is of type PT_LOAD 0x1 (loadable program segment)
The offset is 0x1000 (size of a page - 4096)
vaddr is 0xc0000000 (start of lowmem)
filesz and memsz are both 0x38000000 (size of (kcore-4096))
flags are 0x7 (PF_R | PF_W | PF_X)
page alignment is 0x1000 (size of a page - 4096)
The other remaining part of the structure (p_paddr) is 0x0
From my messages file to compare:
Notes
The next three sections will use this structure:
Looking at the first note (only the interesting part, the rest is zeroed out):
In this case the items shown are not in the same order of the struct. This is because they have been placed in a slightly different order.
First we have the size of the name: 0x5 (strlen(CORE)+1)
Then the data size: 0x90 (size of elf_prstatus struct)
Then the type: 0x1 (NT_PRSTATUS)
Then the name itself: CORE
And finally the data, which has been zeroed out (not shown).
The next note looks like the following:
First we have the size of the name: 0x5 (strlen(CORE)+1)
Then the data size: 0x7c (sizeof(struct elf_prpsinfo))
Then the type: 0x3 (NT_PRPSINFO )
Then the name itself: CORE
And finally the data, which uses the elf_prpsinfo structure:
The data consists of:
pr_state 0x0
pr_sname 0x52 (R)
pr_zomb 0x0
Executable file name (pr_fname) "vmlinux"
Saved command line (pr_psargs) up to 80 characters
ro root=/dev/VolGroup00/LogVol00 rhgb quiet
The rest is zeroed out from a memset command
The third note denotes information about the current task. Here is part of it:
First we have the size of the name: 0x5 (strlen(CORE)+1)
Then the data size: 0x690 (sizeof(struct task_struct) found in linux/sched.h)
Then the type: 0x4 (NT_TASKSTRUCT )
Then the name itself: CORE
And finally the data, which consists of `current' which is the current thread (not shown above).
Now we must dissect task_struct info, which we'll do a bit later...
From elf.h we see that the structure of a program header is:
typedef struct
{
 Elf32_Word    p_type;                 /* Segment type */
 Elf32_Off     p_offset;               /* Segment file offset */
 Elf32_Addr    p_vaddr;                /* Segment virtual address */
 Elf32_Addr    p_paddr;                /* Segment physical address */
 Elf32_Word    p_filesz;               /* Segment size in file */
 Elf32_Word    p_memsz;                /* Segment size in memory */
 Elf32_Word    p_flags;                /* Segment flags */
 Elf32_Word    p_align;                /* Segment alignment */
} Elf32_Phdr;
A look at the first program header below:
0000030: 0000 0000 0400 0000 9400 0000 0000 0000  ................
0000040: 0000 0000 d807 0000 0000 0000 0000 0000  ................
0000050: 0000 0000
The first program header is of type PT_NOTE (Auxiliary info) which has a value of 0x4
We can see that the offset is 0x94
The filesize has a value of 0x7d8
All other parts of the struct are set to 0x0
A look at the second program header below:
0000050: 0000 0000 0100 0000 0010 8038 0000 80f8  ...........8....
0000060: 0000 0000 00e0 ff06 00e0 ff06 0700 0000  ................
0000070: 0010 0000
The type is of type PT_LOAD 0x1 (loadable program segment)
The offset is 0x38801000
vaddr is 0xf8800000 (vmalloc)
filesz and memsz are both 0x6ffe000
flags are 0x7 (PF_R | PF_W | PF_X)
page alignment is 0x1000 (size of a page - 4096)
The other remaining part of the structure (p_paddr) is 0x0
The third program header looks like:
0000070: 0010 0000 0100 0000 0010 0000 0000 00c0  ................
0000080: 0000 0000 0000 0038 0000 0038 0700 0000  .......8...8....
0000090: 0010 0000
The type is of type PT_LOAD 0x1 (loadable program segment)
The offset is 0x1000 (size of a page - 4096)
vaddr is 0xc0000000 (start of lowmem)
filesz and memsz are both 0x38000000 (size of (kcore-4096))
flags are 0x7 (PF_R | PF_W | PF_X)
page alignment is 0x1000 (size of a page - 4096)
The other remaining part of the structure (p_paddr) is 0x0
From my messages file to compare:
Sep 15 12:28:57 kanga kernel:
Memory: 2060724k/2087616k available
(2252k kernel code, 25548k reserved, 1182k data, 284k init, 1170112k highmem)
Sep 15 12:28:57 kanga kernel: virtual kernel memory layout:
Sep 15 12:28:57 kanga kernel:     fixmap  : 0xffc53000 - 0xfffff000   (3760 kB)
Sep 15 12:28:57 kanga kernel:     pkmap   : 0xff400000 - 0xff800000   (4096 kB)
Sep 15 12:28:57 kanga kernel:     vmalloc : 0xf8800000 - 0xff3fe000   ( 107 MB)
Sep 15 12:28:57 kanga kernel:     lowmem  : 0xc0000000 - 0xf8000000   ( 896 MB)
Sep 15 12:28:57 kanga kernel:       .init : 0xc0761000 - 0xc07a8000   ( 284 kB)
Sep 15 12:28:57 kanga kernel:       .data : 0xc063337f - 0xc075ab88   (1182 kB)
Sep 15 12:28:57 kanga kernel:       .text : 0xc0400000 - 0xc063337f   (2252 kB)
Notes
The next three sections will use this structure:
struct memelfnote
{
        const char *name;
        int type;
        unsigned int datasz;
        void *data;
};
Looking at the first note (only the interesting part, the rest is zeroed out):
0000090: 0010 0000 0500 0000 9000 0000 0100 0000  ................
00000a0: 434f 5245
In this case the items shown are not in the same order of the struct. This is because they have been placed in a slightly different order.
First we have the size of the name: 0x5 (strlen(CORE)+1)
Then the data size: 0x90 (size of elf_prstatus struct)
Then the type: 0x1 (NT_PRSTATUS)
Then the name itself: CORE
And finally the data, which has been zeroed out (not shown).
The next note looks like the following:
                            0500 0000 7c00 0000  ............|...
0000140: 0300 0000 434f 5245 0000 0000 0052 0000  ....CORE.....R..
0000150: 0000 0000 0000 0000 0000 0000 0000 0000  ................
0000160: 0000 0000 0000 0000 766d 6c69 6e75 7800  ........vmlinux.
0000170: 0000 0000 0000 0000 726f 2072 6f6f 743d  ........ro root=
0000180: 2f64 6576 2f56 6f6c 4772 6f75 7030 302f  /dev/VolGroup00/
0000190: 4c6f 6756 6f6c 3030 2072 6867 6220 7175  LogVol00 rhgb qu
00001a0: 6965 7400 0000 0000 0000 0000 0000 0000  iet.............
00001b0: 0000 0000 0000 0000 0000 0000 0000 0000  ................
00001c0: 0000 0000 0000 0000
First we have the size of the name: 0x5 (strlen(CORE)+1)
Then the data size: 0x7c (sizeof(struct elf_prpsinfo))
Then the type: 0x3 (NT_PRPSINFO )
Then the name itself: CORE
And finally the data, which uses the elf_prpsinfo structure:
struct elf_prpsinfo
{
       char    pr_state;       /* numeric process state */
       char    pr_sname;       /* char for pr_state */
       char    pr_zomb;        /* zombie */
       char    pr_nice;        /* nice val */
       unsigned long pr_flag;  /* flags */
       __kernel_uid_t  pr_uid;
       __kernel_gid_t  pr_gid;
       pid_t   pr_pid, pr_ppid, pr_pgrp, pr_sid;
       /* Lots missing */
       char    pr_fname[16];   /* filename of executable */
       char    pr_psargs[ELF_PRARGSZ]; /* initial part of arg list */
};
The data consists of:
pr_state 0x0
pr_sname 0x52 (R)
pr_zomb 0x0
Executable file name (pr_fname) "vmlinux"
Saved command line (pr_psargs) up to 80 characters
ro root=/dev/VolGroup00/LogVol00 rhgb quiet
The rest is zeroed out from a memset command
The third note denotes information about the current task. Here is part of it:
                            0500 0000 9006 0000  ................
00001d0: 0400 0000 434f 5245 0000 0000 0000 0000  ....CORE........
00001e0: 0020 b2f0 0200 0000 0021 4000 ffff ffff  . .......!@.....
00001f0: 7800 0000 7800 0000 7800 0000 b086 8af0  x...x...x.......
0000200: b086 8af0 4072 63c0 0004 0000 0000 4000  ....@rc.......@.
0000210: 0100 0000 0000 0000 0000 0000 0100 0000  ................
0000220: 494c 6a33 c10a 0000 2fd2 1d00 0000 0000  ILj3..../.......
0000230: 85b4 abc6 0c01 0000 6134 0c00 0000 0000  ........a4......
0000240: 0000 0000 0000 0000 5669 0d00 0000 0000
First we have the size of the name: 0x5 (strlen(CORE)+1)
Then the data size: 0x690 (sizeof(struct task_struct) found in linux/sched.h)
Then the type: 0x4 (NT_TASKSTRUCT )
Then the name itself: CORE
And finally the data, which consists of `current' which is the current thread (not shown above).
Now we must dissect task_struct info, which we'll do a bit later...
Thursday, August 14, 2008
ELF headers: executable vs /proc/kcore
This is for 32bit
According to elf.h:
Sizes for ELF32_* (in bytes):
Word: 4
Half: 2
Off: 4
Addr: 4
Looking at a regular binary like ls for example:
I'm using the ELF manual to analyze this.
The first line (16 bytes) is the (e_ident) value which consists of:
The ``magic'' value for the first four characters - 7f45 4c46
The file class (EI_CLASS) - 0x1 (ELF32CLASS)
Data encoding (EI_DATA) - 0x1 (ELFDATA2LSB) little endian
File version (EI_VERSION) - 0x1 current
Start of padded bytes (EI_PAD)
On the second line (e_type) 0x2 tells us it is an executable file
(e_machine) value 0x3 tells us that this was compiled on Intel Architecture
(e_version) value 0x1 tells us it is current
(e_entry) virtual address to which to control is given is 0x8049900
(e_phoff) Program headers start at offset 0x34
On the third line 0x17fec is the section header offset (e_shoff)
(e_flags) value 0x0 tells us that no flags are set
(e_ehsize) value of 0x34 tells that the header is of size 52 bytes decimal
(e_phentsize) value of 0x20 tells that one entry in the program header table size is 32 bytes
(e_phnum) value of 0x8 tells us the number of entries in the program header table is 8
(e_shentsize) value of 0x28 tells us the size of one entry in the section header table is 40 bytes
On the fourth line
(e_shnum) value of 0x20 tells us that number of entries in the section header table is 32
(e_shstrndx) value of 0x1f holds the section header table index of the entry associated with the section name string table
So what does /proc/kcore look like?
The first line is the same as above.
The second line:
(e_type) 0x4 tells us it is a core file (ET_CORE) *
(e_machine) value 0x3 tells us that this was compiled on Intel Architecture
(e_version) value 0x1 tells us it is current
(e_entry) virtual address to which to control is given is 0x0
(e_phoff) program headers start at offset 0x34
* this is useful to know if we are dealing with a core file...
In the third line:
(e_shoff) value is 0x0 letting us know there is no section header offset
(e_flags) value 0x0 tells us that no flags are set
(e_ehsize) value of 0x34 tells that the elf header is of size 52 bytes decimal
(e_phentsize) value of 0x20 tells that one entry in the program header table size is 32 bytes
(e_phnum) value of 0x3 tells us the number of entries in the program header table is 3
(e_shentsize) value of 0x0 tells us that there is no section header
The fourth line values are all 0x0
To make your life easier here is a C program that will extract all of that information for you :-) You must be root to run it.
Note: I know I could have done this a bit more elegantly, but decided against that...
According to elf.h:
#define EI_NIDENT (16)

typedef struct
{
  unsigned char e_ident[EI_NIDENT];     /* Magic number and other info */
  Elf32_Half    e_type;                 /* Object file type */
  Elf32_Half    e_machine;              /* Architecture */
  Elf32_Word    e_version;              /* Object file version */
  Elf32_Addr    e_entry;                /* Entry point virtual address */
  Elf32_Off     e_phoff;                /* Program header table file offset */
  Elf32_Off     e_shoff;                /* Section header table file offset */
  Elf32_Word    e_flags;                /* Processor-specific flags */
  Elf32_Half    e_ehsize;               /* ELF header size in bytes */
  Elf32_Half    e_phentsize;            /* Program header table entry size */
  Elf32_Half    e_phnum;                /* Program header table entry count */
  Elf32_Half    e_shentsize;            /* Section header table entry size */
  Elf32_Half    e_shnum;                /* Section header table entry count */
  Elf32_Half    e_shstrndx;             /* Section header string table index */
} Elf32_Ehdr;
Sizes for ELF32_* (in bytes):
Word: 4
Half: 2
Off: 4
Addr: 4
Looking at a regular binary like ls for example:
$ dd if=/bin/ls bs=52 count=1|xxd
1+0 records in
1+0 records out
52 bytes (52 B) copied, 3.6108e-05 s, 1.4 MB/s
0000000: 7f45 4c46 0101 0100 0000 0000 0000 0000  .ELF............
0000010: 0200 0300 0100 0000 0099 0408 3400 0000  ............4...
0000020: ec7f 0100 0000 0000 3400 2000 0800 2800  ........4. ...(.
0000030: 2000 1f00                                ...
I'm using the ELF manual to analyze this.
The first line (16 bytes) is the (e_ident) value which consists of:
The ``magic'' value for the first four characters - 7f45 4c46
The file class (EI_CLASS) - 0x1 (ELF32CLASS)
Data encoding (EI_DATA) - 0x1 (ELFDATA2LSB) little endian
File version (EI_VERSION) - 0x1 current
Start of padded bytes (EI_PAD)
On the second line (e_type) 0x2 tells us it is an executable file
(e_machine) value 0x3 tells us that this was compiled on Intel Architecture
(e_version) value 0x1 tells us it is current
(e_entry) virtual address to which to control is given is 0x8049900
(e_phoff) Program headers start at offset 0x34
On the third line 0x17fec is the section header offset (e_shoff)
(e_flags) value 0x0 tells us that no flags are set
(e_ehsize) value of 0x34 tells that the header is of size 52 bytes decimal
(e_phentsize) value of 0x20 tells that one entry in the program header table size is 32 bytes
(e_phnum) value of 0x8 tells us the number of entries in the program header table is 8
(e_shentsize) value of 0x28 tells us the size of one entry in the section header table is 40 bytes
On the fourth line
(e_shnum) value of 0x20 tells us that number of entries in the section header table is 32
(e_shstrndx) value of 0x1f holds the section header table index of the entry associated with the section name string table
So what does /proc/kcore look like?
# dd if=/proc/kcore bs=52 count=1|xxd
1+0 records in
1+0 records out
52 bytes (52 B) copied, 3.9321e-05 s, 1.3 MB/s
0000000: 7f45 4c46 0101 0100 0000 0000 0000 0000  .ELF............
0000010: 0400 0300 0100 0000 0000 0000 3400 0000  ............4...
0000020: 0000 0000 0000 0000 3400 2000 0300 0000  ........4. .....
0000030: 0000 0000                                ....
The first line is the same as above.
The second line:
(e_type) 0x4 tells us it is a core file (ET_CORE) *
(e_machine) value 0x3 tells us that this was compiled on Intel Architecture
(e_version) value 0x1 tells us it is current
(e_entry) virtual address to which to control is given is 0x0
(e_phoff) program headers start at offset 0x34
* this is useful to know if we are dealing with a core file...
In the third line:
(e_shoff) value is 0x0 letting us know there is no section header offset
(e_flags) value 0x0 tells us that no flags are set
(e_ehsize) value of 0x34 tells that the elf header is of size 52 bytes decimal
(e_phentsize) value of 0x20 tells that one entry in the program header table size is 32 bytes
(e_phnum) value of 0x3 tells us the number of entries in the program header table is 3
(e_shentsize) value of 0x0 tells us that there is no section header
The fourth line values are all 0x0
To make your life easier here is a C program that will extract all of that information for you :-) You must be root to run it.
Note: I know I could have done this a bit more elegantly, but decided against that...
Tuesday, July 15, 2008
Linux Memory Forensics
I knew something good would come out of the DFRWS forensic challenge. This is really great. I just had to say something about it :-)
I would have liked to have worked on the challenge myself, but with a full-time teaching schedule and other projects, just couldn't fit in the time. I was anxious to see what would happen this year, however.
Good job, guys :-)
I would have liked to have worked on the challenge myself, but with a full-time teaching schedule and other projects, just couldn't fit in the time. I was anxious to see what would happen this year, however.
Good job, guys :-)
Subscribe to:
Posts (Atom)